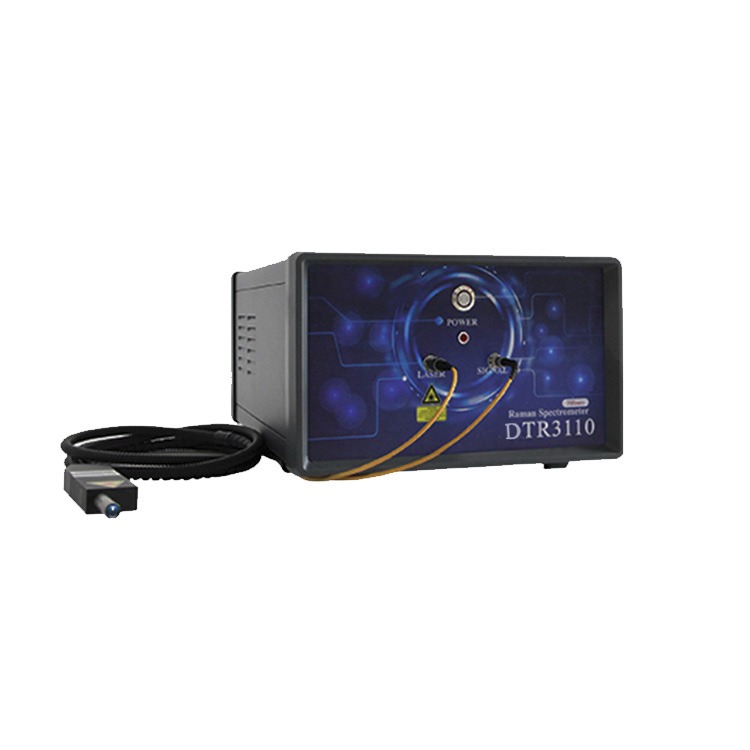
In the realm of the semiconductor industry, Raman spectrometers play a pivotal role in examining the fundamental properties of semiconductor materials. These materials encompass single elements such as silicon (Si) and germanium (Ge), as well as more complex compositions like zinc selenium (ZnSe) and gallium arsenide (GaAs) semiconductors. The characteristics of these semiconductor materials during manufacturing significantly impact the quality of subsequent processes like wafer manufacturing and IC packaging, making this stage absolutely critical.
Utilizing Raman spectrometers as tools for process analysis and quality control during wafer manufacturing can lead to improved product quality, increased yield rates, and ultimately higher overall productivity.
Presently, Raman spectrometers find various applications in the semiconductor industry, including:
Material purity analysis
Identification of contaminants
Determining alloy compositions
Analyzing superlattice structures
Studying characteristic factors of intrinsic stress and strain
Defect analysis
Investigating semiconductor heterostructures
Examining doping effects of heterojunctions
What is ZnSe?
ZnSe stands as a prototypical II-VI semiconductor material, possessing a zinc blend structure and a direct band gap. At room temperature (300K), its band gap is 2.698eV, and at low temperatures (<10K), it increases to 2.821eV, corresponding to blue light with a wavelength of 459.4nm.
Applications and Research of ZnSe
Researchers have employed thermal evaporation of ZnSe powder in a high vacuum for various applications. Deposition of ZnSe monolayers with thicknesses ranging from 30 nm to 1 µm on c-Si and glass substrates has been achieved at room temperature.
Furthermore, researchers have investigated SiOx/ZnSe periodic multilayer films using the same deposition technique, with ZnSe layer thicknesses of 2 and 4 nm. The Raman spectra, measured at 295K with various laser lines, revealed distinct Raman signatures corresponding to multiple optical phonon (1LO to 4LO) light scattering and randomly oriented crystalline ZnSe grains in both monolayers and multilayers.
Notably, relatively large line widths of the 1LO band (approximately 15 cm-1) were observed, which were associated with lattice distortions in the grains and the presence of amorphous phases in layers thinner than 100 nm.
The Behavior of ZnSe in Raman Analysis
During the experiments, all measurements were conducted in air at room temperature, and the spectra were plotted on the same graph with consistent scaling.
In the upper panels, Raman spectra of 1 µm (a) and 30 nm (b) ZnSe monolayers and SiOx (4 nm)/ZnSe (4 nm) multilayers (c) were measured under three different laser excitations.
Figure 1a showcases three Raman spectra of a 1 µm-thick ZnSe layer deposited on a Corning 7059 glass substrate. Superior resolution was obtained with excitation conditions near the resonance Raman scattering conditions.
The most substantial enhancement of the Raman signal was observed when the excitation light closely matched the material's optical bandgap, Eg0. This aligns with prior findings indicating that for a 1 µm-thick ZnSe layer, the optical absorption follows the laws of directly allowed electronic transitions in crystalline semiconductors.
Figures b and c exhibit the Raman spectra of a 30 nm-thick ZnSe layer and a SiOx (4 nm)/ZnSe (4 nm) multilayer, respectively, both deposited on a c-Si substrate. In these spectra, a narrow solid band peaked at 521 cm-1 appeared due to scattering from the substrate. The 1LOZnSe band intensity increased with decreasing excitation wavelength, and a series of 4 peaks were visible only in the spectrum excited by the 457.9 nm line.
In practical applications, SiOx/ZnSeML (with various thicknesses between 2 and 10 nm) were characterized using Raman spectroscopy with the 442 nm line, revealing resonance behavior in the Raman spectrum associated with size-induced variation of the bandgap energy with layer thickness.
The Raman spectra of ZnSe monolayers with four different thicknesses are depicted, showing that the 30 nm layer's 1LO band exhibited significantly higher intensity than the other samples. The results indicate that ZnSe layers with thicknesses less than 50 nm can exhibit excellent chemical sensitivity due to their small grain size.
Fourier Transform Infrared Spectroscopy (FTIR), also known as FTIR Spectroscopy or Fourier Infrared Spectroscopy, is a type of infrared spectrometer that operates on the principle of Fourier transform of infrared light after interference.
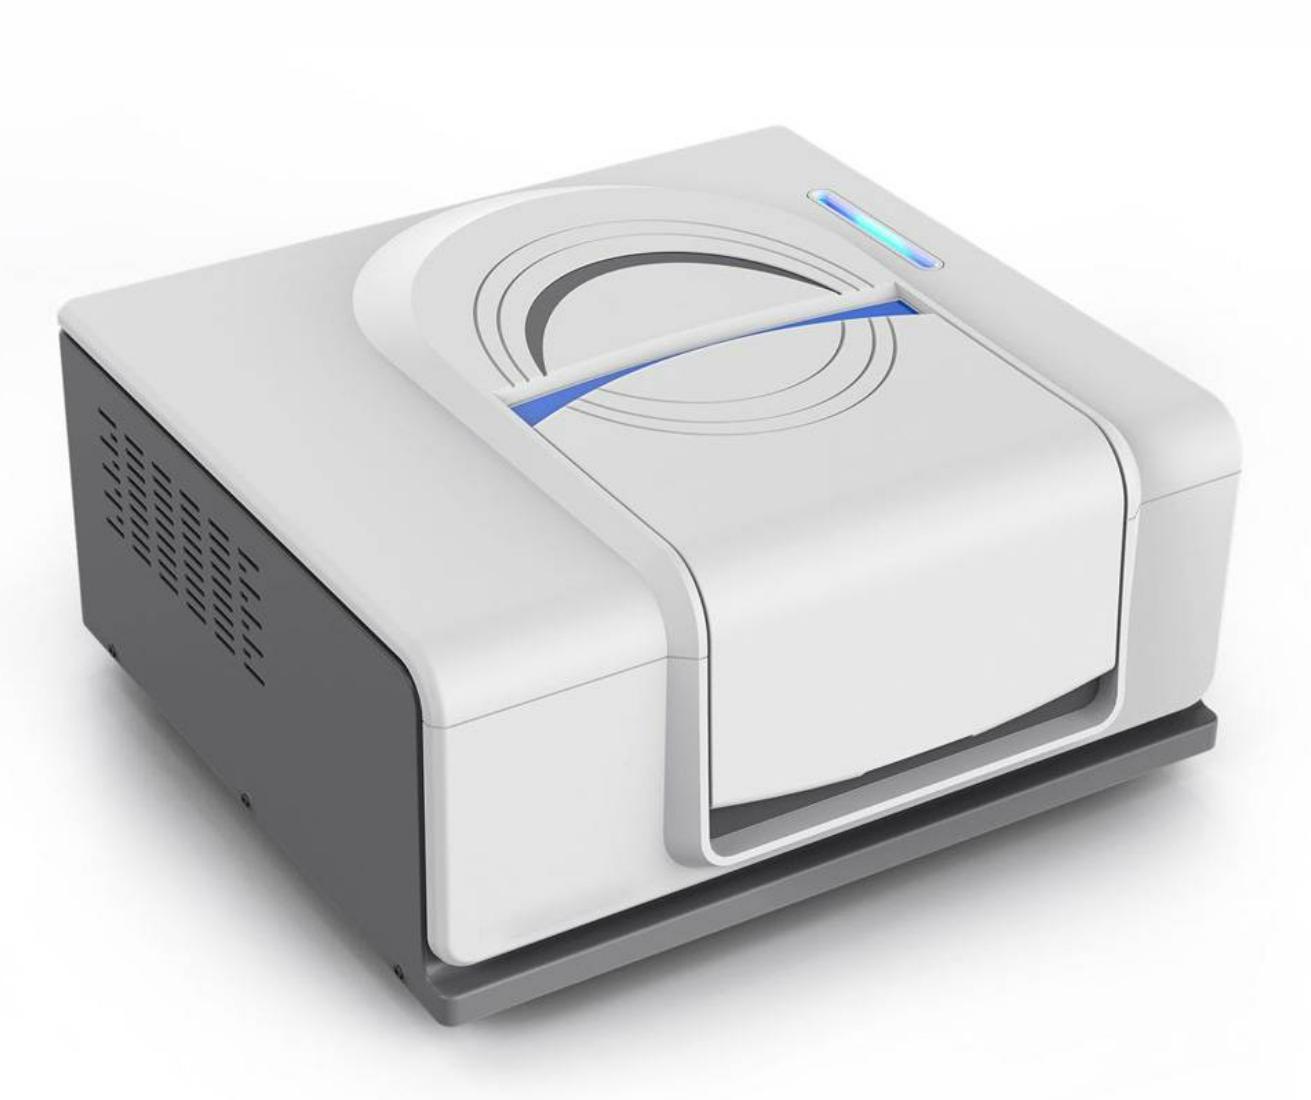
The FTIR spectrometer functions by splitting light from a light source into two beams using a beam splitter, similar to a half mirror. One beam is directed towards a moving mirror, while the other beam is reflected by a fixed mirror. These two beams of light are then reflected back to the beam splitter, resulting in an optical path difference and causing interference.
After passing through the beam splitter, the converged interference light passes through a sample cell. As the light travels through the sample, it carries information about the sample's composition. The detector receives the interference light containing the sample information, which is then subjected to Fourier transformation to obtain the transmittance and absorbance at specific wavenumbers or wavelengths.
FTIR spectrometers possess several notable features:
High signal-to-noise ratio: Due to the minimal use of optical components and the absence of a grating or prism beam splitter, FTIR spectrometers reduce light loss and enhance signal strength through interference, resulting in a higher signal-to-noise ratio.
Excellent reproducibility: Fourier transform processing of the light signal in FTIR spectrometers avoids errors associated with motor-driven grating light splitting, leading to improved reproducibility.
Rapid scanning speed: FTIR spectrometers collect data across the entire waveband, and the resulting spectrum is an average of multiple data collections. Consequently, a complete data collection can be accomplished in a matter of seconds, while dispersive instruments only test a narrow frequency range at any given moment, requiring ten to twenty minutes for a complete data acquisition.
Infrared spectroscopy, including FTIR, offers numerous advantages, such as its versatility in analyzing various sample states (solid, liquid, or gas) and its broad application range in detecting inorganic, organic, and polymer compounds. It is a non-destructive analytical technique with high sensitivity, rapid analysis, minimal sample consumption, ease of operation, and powerful qualitative capabilities when combined with chromatography or thermal analysis.
FTIR spectrometers are capable of addressing several analytical challenges, including:
Identification of known objects.
Structural identification of unknown substances.
Quantitative analysis of specific materials.
Micro-infrared analysis of trace substances on product surfaces, such as residues, powders, liquids, oxidation, corrosion, and foreign components.
Polymer consistency determination, where FTIR excels due to the distinctive spectral peaks corresponding to different groups and arrangements of groups in various substances. Comparing infrared spectra allows for differentiation between compounds in samples and the determination of material consistency. Comprehensive analysis of component content, physical and chemical properties, etc., alongside FTIR, enhances consistency analysis results.FTIR spectrometers find applications in various fields, including the analysis of unprocessed plastic raw materials (granules) or processed plastic parts like housings and printed circuit boards (PCBs).
The primary objectives of material consistency determination with FTIR are:
Troubleshoot product abnormalities by examining material aspects.
Monitor product consistency, ensuring the presence of the same ingredients, batch, and manufacturer.
Effectively control the use of recycled materials or scraps by plastic material suppliers.
Perform reverse analysis of products, accurately identify unknown materials, and achieve cost savings.
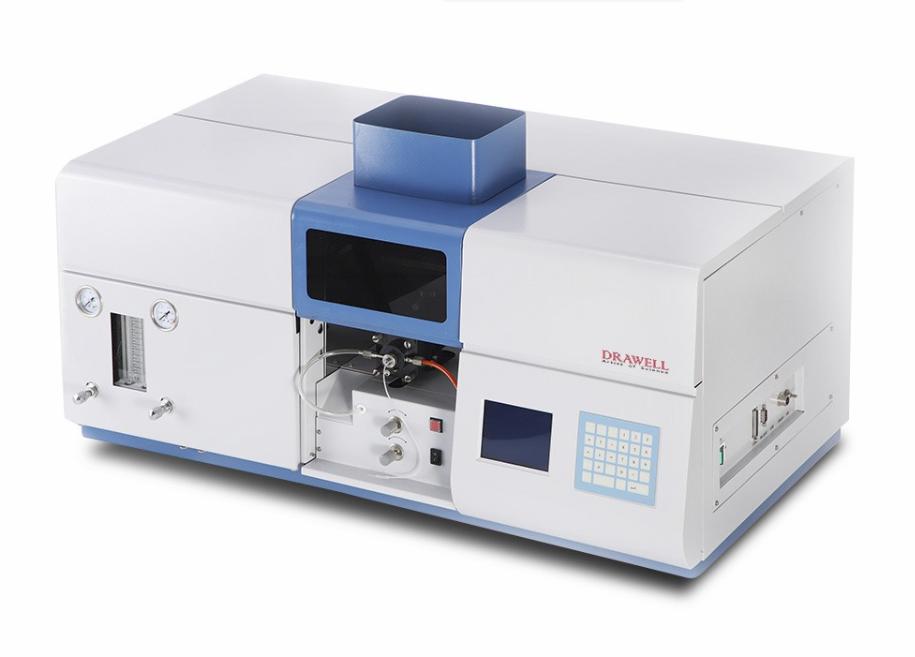
The pretreatment of samples is a complex task when analyzing test substances, and it holds significant importance in the overall analysis and detection process. It also plays a crucial role in identifying the source of detection errors. This article aims to summarize four fundamental pretreatment methods used for samples in atomic absorption spectrometry (AAS) analysis. Additionally, it discusses the basic detection methods for six types of samples commonly encountered in routine analysis and detection. These methods are practical and can serve as valuable references for users of AAS instruments.
Wet Digestion Method:
For samples weighing approximately 0.1000 to 0.5000g, the commonly used approach involves utilizing mixed acids. The following acid ratios are often employed:
(1) HNO3:HCLO3 = 5:1
(2) HNO3:H2SO4 = 5:1
(3) HNO3:HCl = 5:1
(4) Pure HNO3
Note: It is crucial to avoid the presence of volatile (acetone, ether, ethanol, etc.), flammable, and explosive substances during the digestion process. The wet digestion method is widely employed and well-known, so further elaboration is unnecessary.
Dry Ashing Method:
Typically, samples weighing between 2.000 and 5.000g are treated using the dry ashing method, which prevents volatilization. The procedure involves placing the sample in a porcelain crucible, adding a few drops of water to wet it, followed by a small amount of concentrated nitric acid. Heat is then applied to carbonize the sample over a low flame. The crucible is subsequently transferred to a muffle furnace for ashing at approximately 550°C for 2 to 4 hours. After cooling, the ash (colorless or light in color) is dissolved using other acids, often in a 1:1 ratio with nitric acid (varies depending on the sample). The solution is then filtered, adjusted to volume, and aliquoted into 10mL, 25mL, and 50mL portions for further use.
High-Pressure Tank Method (Using a Lidded Tank Made of Polytetrafluoroethylene):
When the sample weighs less than 0.3000g, this method is employed. It involves adding 6mL of mixed acid and 1mL of HF(H2O2) to the sample. The autoclave is sealed, and the sample is heated at 160°C for 5 hours. After cooling, the solution is filtered and adjusted to the desired volume for subsequent analysis.
Microwave Digestion Method:
The microwave digestion method utilizes commonly used mixed acids, including:
(1) HNO3:HCLO3
(2) HNO3:H2SO4
(3) Pure HNO3
Note: The choice of specific acid for digestion varies depending on the sample. Readers are encouraged to select the appropriate acid accordingly.
AAS Analysis and Detection Methods for Various Samples:
Analysis of Pb, Cd, As, Mo, Cr, etc. (Graphite Furnace AAS Method):
For Pb analysis, a 1.0mL sample is diluted to 10mL with 1% HNO3. The linear range is 0 to 20ng/mL, with drying temperature set between 80 and 100°C, ashing temperature at 200°C, and atomization temperature at 1500°C.
For Cd analysis, a 1.0mL sample is diluted to 10mL with deionized water. The linear range is 0.1 to 0.4ng/mL, with the same drying, ashing, and atomization temperatures as Pb.
For As analysis, a 1.0mL sample is combined with 100μL of Ni (2mg/mL) and diluted to 10mL with 1% HNO3. The linear range is 0 to 4ng/mL, with the same drying, ashing, and atomization temperatures as Pb.
For Mo analysis, a 1.0mL sample is diluted to 10mL with 1% HNO3. Pd is used as the modifier, and the linear range is 0 to 20ng/mL, with the same drying, ashing, and atomization temperatures as Pb.
For Cr analysis, 1mL of the sample is diluted to 100mL with deionized water. The linear range is 0 to 40ng/mL, with the same drying, ashing, and atomization temperatures as Pb.
The sensitivity of an atomic absorption spectrophotometer (hereafter AAS ) decreases after some time of use. This immediately leads to an increase in the detection limit of the instrument, which even exceeds the requirements of the calibration regulations, so that it is classified as unfit for use. In this article, the reasons for the decrease in sensitivity and the corresponding countermeasures are analyzed of the AAS will be explored.
Optical path system of AAS
1. Is the position of the hollow cathode lamp the best?
The hollow cathode lamp can radiate the resonance line of the element to be measured and has sufficient radiation intensity to ensure a sufficient signal-to-noise ratio.
If the position of the hollow cathode lamp deviates, the light energy is lost in the light path.
The light signal entering the detector is weakened accordingly, and the measurement sensitivity of the instrument is reduced.
Therefore, after each lamp change, the position of the lamp socket should be adjusted to maximize the energy reading of the instrument.
2. Is the most sensitive spectral line selected?
A hollow cathode lamp of an element often has many emission lines.
The most sensitive spectral line should be selected for measurement.
Some resonance spectral lines are relatively close to each other. For example, the manganese lamp has a spectral line at 279.5 nm, 279.8 nm, and 280.1 nm, and the spectral line at 279.5 nm is the most sensitive.
If the wavelength display of the instrument has some error, it can be easily confused if not carefully distinguished.
3. Is the lamp’s current setting appropriate?
The light intensity of a hollow cathode lamp is related to the lamp current.
Increasing the lamp's operating current can increase the emission intensity.
However, if the operating current is too high, abnormal discharge will occur and the light intensity will be unstable.
If the lamp current is too low, the light intensity of the lamp will be weakened, resulting in a decrease in stability and signal-to-noise ratio.
Therefore, it is important to select a suitable lamp.
The optimum lamp current varies depending on the cathode element and lamp design.
AAS atomization system
1. Whether the injection capillary is clogged.
The function of the capillary is to aspirate the sample solution.
If the injection capillary is clogged with impurities, the injection speed will be greatly reduced and no strong signal will be generated.
It must be dredged out with a fine wire or replaced with a new capillary.
2. Is the pressure of the compressed air too low?
Compressed air is not only involved in combustion as an auxiliary gas, but also creates a negative pressure at the capillary orifice to take up the sample solution.
The drop in pressure of the compressed air leads to insufficient negative pressure at the capillary aspiration opening and slows down the aspiration speed of the sample.
Therefore, check whether the output pressure of the air compressor is too low, whether there are leaks in the air line and whether the air flow is set too low.
3. Whether there is a water seal in the waste liquid pipe
If there is no water seal in the waste water line or the water seal is not tight, the liquid outlet line will be connected to the outside atmosphere, the negative pressure in the atomization chamber will be reduced, and the sample suction speed will also be slowed down or even no sample will be sucked.
4. Whether the burner contains too many solid pollutants
After the burner has been in operation for some time, it picks up some solids, including carbon deposits and inorganic salts in the solution.
The presence of these substances significantly affects the characteristics of the flame, such as zigzag flame, unstable flame, uneven flame and so on.
At the same time, they increase the signal noise, which leads to unstable measurement results.
Therefore, it needs to be cleaned in time.
Combination of optical path system and atomization system
The generation of luminosity is caused by the absorption of the characteristic spectral lines emitted from the light source by the atomic absorption spectrophotometer in the ground state.
The greater the number of ground state atoms, the greater the absorption.
When the line of the light source passes through the burner, the line of the light source should pass completely and parallel through the flame, i.e., the atomized layer, to produce a strong enough absorption signal so that the measurement sensitivity is high. Therefore, check and adjust the height and orientation of the burner.
Over the last few years, there has been a significant increase in the use of portable X-ray fluorescence throughout the business. Initially developed for alloy and scrap metal identification, the technology was eventually shown to be successful in environmental field monitoring, notably contaminated land and remedial operations. The application of portable XRF in soil research has pushed the growth of mineral prospecting. And, as a result of continuous advancements in XRF technology, XRF is now more responsive and accurate; these advancements have altered the way scientists perform real-time in situ and field research.

Can a portable XRF detector be used to test the purity of gold?
The flame test method is the most often used method for detecting gold content. A flame melts the metal, and the concentration of gold or other metal components is determined. For a long time, the flame method was thought to be the most effective approach to detect gold. However, such detecting procedures are damaging and unfavorable to pawn shops.
When we developed the Handheld XRF Gold Analyzer, we analyzed six large flat objects made of different grades and compositions of gold, and we found that the accuracy was typically within 0.1% or 0.2% of the flame analysis results. The experiment concludes that TrueX Gold can completely test the composition of items with high accuracy.
We tested the Handheld XRF Gold Analyzer on six large flat objects made of various gold grades and compositions and discovered that the accuracy was often within 0.1% or 0.2% of the flame analysis results. The trial concludes that TrueX Gold can accurately test the composition of objects.

Advantages of portable XRF for gold detection
X-ray fluorescence analysis technology (XRF)'s intelligent non-destructive testing tool can precisely detect the concentration of various elements in gold, platinum, palladium, K gold, K platinum, and other jewelry. Multi-channel analyzers are used in the EXF series precious metal detectors, while spectrum analysis technology is used to accurately and vividly present the content and ratio of gold, platinum, palladium, silver, rhodium, copper, zinc, nickel, and many other elements in jewelry in the form of a spectrum.

Can X-ray fluorescence fully replace gold flame detection?
It is indisputable that X-ray fluorescence may not only examine the validity of gold, but also, and most crucially, analyze its exact purity. The purity of the gold is frequently what impacts the pawnshop's income. The X-ray fluorescence is an effective method for identifying gold, although it cannot detect heavy plating or counterfeiting. As a result, we strongly advise utilizing X-ray fluorescence as a secondary test to guarantee that there is no thick coating or counterfeiting.