A spectrophotometer is an equipment that employs purer monochromatic light as incident light to measure the absorption of light by compounds and perform qualitative or quantitative analysis of substances. Digital spectrophotometers, UV spectrophotometers, fluorescence spectrophotometers, and other types of spectrophotometers are commonly used. During use, spectrophotometer measurement errors are common. How do these mistakes happen?
1.Polychromatic Light's Deviation from the Contrast Ear Law
Beer's law cannot be established unless the light emitted by humans is monochromatic. Even a spectrophotometer with a dual monochromator, however, can only produce nearly monochromatic light and cannot produce pure monochromatic light. It still has a narrow light passband and polychromatic light characteristics. Beer's law will deviate in either a positive or negative direction due to the polychromatic light. An ultraviolet spectrophotometer's spectral bandwidth is normally 1nm or 2nm, with a minimum adjustable slit of 0.1nm; a visible spectrophotometer's bandwidth is 6nm, or even more than ten nanometers.
The spectral bandwidth should be kept to a minimum. However, as the spectral resolution increases, the instrument's sensitivity decreases. As a result, when picking an instrument, the impact of various conditions should be examined. For example, when the concentration of the solution is low, the light is monochromatic, and the color of the light is purer, Beer's law can be roughly applied.
2.The effect of stray light
Stray light is defined as other wavelength components that enter the detector outside of the spectral bandwidth of the wavelength to be measured, and it is the primary source of error in spectrum measurement.
The reasons are the spectrophotometer's dispersion element, the mirror, the lens, and dust on the inner wall of the monochromator. Stray light has a greater influence at the edge wavelength of the spectrophotometer's working band due to the poor transmittance of the monochromator, the radiation intensity of the light source, and the sensitivity of the detector.
Stray light limit instrument analysis's upper limit can result in substantial measurement mistakes. In actual work, the absorbance of the sample is often measured at or near the absorption peak in quantitative analysis. If stray light is present at the analysis wavelength, the sample's transmittance rate is low, and most of the stray light is transmitted, causing the recorded absorbance to be lower than the true absorbance.
3.The impact of instrument noise on measurement Tool
Instrument noise is a good sign of instrument error. It represents the instrument's ability to prepare dilute solutions. It is an undesirable signal superimposed on the to-be-measured analytical signal. Scan the 100%T and 0%T lines to get the spectrophotometer's absolute noise level. The smaller measurement signal will be obscured if the instrument is noisy. In general, twice the noise is employed to describe the instrument's sensitivity.
4.Wavelength and absorbance precision
Each measured sample value should be measured at a given wavelength. The measured value will be erroneous if the wavelength error is significant.
Selection of measurement conditions
1. Selection of reference solution and solvent
To determine the absorbance of the sample, the spectrophotometer utilizes the light intensity of the reference cell as the light intensity of the person. Adjust the instrument so that the absorbance of the solution passing through the reference cell is zero, and then pass the same light through the sample. Because the absorbance truly reflects the concentration of the substance to be tested, the reference solution is critical.
Pure solvent or distilled water can be used as the reference solution if just the reaction product of the chemical is examined and the developer is absorbed. Use the developer solution as the reference solution if the developer has color and absorbs at the measurement wavelength. The developer and other reagents should be introduced in the same proportion as the sample.
Use the sample solution without the developer as the reference solution if the color of other components in the sample interferes with the measurement and the developer used has no color.
The correct solvent selection plays a vital role in improving the accuracy of the analysis. A high-purity solvent should be used to decrease the influence of impurities in the solvent; the solvent should not chemically react with the test material; the test substance must have a certain solubility in the solvent; and if the solvent itself does not absorb light within the measured wavelength range, When measuring absorption, the shortest available wavelength of common solvents should be used; if a volatile solvent is used, the absorption cell should be covered during the measurement.
2. Selection of test wavelength
When measuring the solution with a spectrophotometer, you must first select the appropriate measurement wavelength. The absorption curve of the tested solution is used to make the decision. In general, we select the greatest absorption wavelength as the measurement wavelength to improve sensitivity.
In some cases, the maximum absorption peak is very sharp, the absorption is too large, or there is interference nearby, and the other wavelengths in the absorption curve must be chosen for determination while ensuring a certain sensitivity (the curve is more Corresponding wavelength on the flat surface) to eliminate interference. Drawing the absorption curve is an effective tool and strategy for selecting the correct wavelength.In general, there are two causes of spectrophotometer error: the error generated by the instrument's quality and manufacturing process, and the error induced by variable measurement conditions. Because there are so many different types of spectrophotometers on the market, the most important thing is to find one that is right for you.
I strongly recommend Drawer Scientific's spectrophotometers towards the end of the article. Digital spectrophotometers, UV spectrophotometers, fluorescence spectrophotometers, and other spectrophotometers are available from them. You can get things that are appropriate for your needs. If you have any questions regarding selecting a spectrophotometer, you may consult the engineers, who will be pleased to assist you.
A spectrophotometer is an important scientific device that divides complicated light into spectral lines. The spectrometer's measurement range normally comprises the visible light region with wavelengths ranging from 380 to 780 nm and the ultraviolet light region with wavelengths ranging from 200 to 380 nm. Because different light sources have varied emission spectra, different luminous bodies can be utilised as the instrument's light source. A tungsten lamp's emission spectrum: light of 380-780nm wavelength emitted by a tungsten lamp is refracted by a prism to produce a continuous chromatogram consisting of red, orange, yellow, green, blue, indigo, and violet; this chromatogram can be utilised as visible light. The spectrophotometer's light source. The spectral range of the spectrometer.

The visible light area of the spectrometer has a wavelength range of 400 to 760 nm, and the ultraviolet light region has a wavelength range of 200 to 400 nm. Because different light sources have varied emission spectra, different luminous bodies can be utilised as the instrument's light source.
The tungsten lamp emission spectrum: a prism is used to refract the light spectrum of 400760nm wavelength emitted by the tungsten lamp light source, resulting in a continuous chromatogram composed of red-orange, yellow-green, blue indigo, and purple; this chromatogram can be used as a visible light spectrophotometer light source.
The absorption spectrum of the substance
If a solution of a certain substance is placed between the light source and the prism, the spectrum displayed on the screen is no longer the spectrum of the light source, and several dark lines appear, indicating the light source emission spectrum of certain wavelengths. The solution absorbs and vanishes. This spectrum is known as the solution's absorption spectrum once it has been absorbed by the solution. various substances have various absorption spectra. As a result, the chemicals in the solution can be identified using the absorption spectrum.

Use of spectrometer
Nucleic acid quantification
The spectrophotometer's most commonly utilised function is nucleic acid quantification. The spectrometer can measure the concentration of oligonucleotides, single-stranded and double-stranded DNA, and RNA in buffer. The absorption wavelength of nucleic acid's maximum absorption peak is 260 nm. Because each nucleic acid's molecular makeup differs, so does its conversion factor. To quantify various forms of nucleic acids, the correct coefficients must be chosen ahead of time. 1OD absorbance, for example, is similar to 50g/ml dsDNA, 37g/ml ssDNA, 40g/ml RNA, and 30g/ml Olig.
After the test, the absorbance value is translated by the aforementioned coefficient to obtain the matching sample concentration. Select the correct programme before the test, enter the volume of the original solution and the diluent, and then test the blank solution and sample solution. However, the endeavour was not without its challenges. The most difficult problem for experimenters may be unstable readings. The larger the shift in absorbance, the greater the sensitivity of the device.
Direct quantification of protein (UV method)
This method involves directly testing the protein at 280nm. If you use the Warburg formula, the photometer will display the sample concentration immediately, or you can use the associated conversion technique to convert the absorbance value to the sample concentration. The protein determination procedure is straightforward: first test the blank solution, then test the protein directly. Because the buffer contains certain impurities, it is usually essential to remove the 320nm "background" information and turn this function on. The absorbance value of A280, like that of the test nucleic acid, must be larger than 0.1A, and the optimal linear range is between 1.0 and 1.5. The direct protein quantification approach is best suited for assessing purer, single-component proteins. The UV direct quantification approach is faster and easier to use than the colorimetric method; nevertheless, it is sensitive to interference from parallel compounds such as DNA; it also has low sensitivity and requires a higher concentration of protein.
Bacterial cell density
A laboratory spectrometer can be used to determine the growth density and period of bacteria. The OD600 method is the industry standard for monitoring the development of microorganisms in liquid cultures. As the blank solution, use the culture solution without bacteria, and then quantify the culture solution with bacteria after the culture. The OD value of the bacterial solution may appear negative at times during the experiment. The color-developing media is utilised, which means that once the bacteria have been grown for a while, they react with the medium and generate a colour change reaction. Furthermore, the analysed samples cannot be centrifuged, and the bacteria must be kept in suspension.
Based on X-ray theory, the alloy analyzer was born. It is primarily utilised in the military, aerospace, steel, petrochemical, electric power, pharmaceutical, and other areas to determine elemental composition of metal products.

How does the Alloy Analyzer Work
The alloy analyzer is a type of XRF spectroscopic analytical tool that can be used to confirm and quantify certain elements in a product. It can identify the specific element based on the X-ray's emission wavelength () and energy (E), and it can quantify the amount of that element by measuring the density of the related ray. XRF can thus assess the elemental composition of substances.
Each atom contains a set number of electrons (negatively charged particles) that orbit the nucleus. And the amount of electrons in the nucleus equals the number of protons (positively charged particles). The number of protons can be calculated from the number of atoms in the periodic table. Each atomic number is assigned to a specific element name, for as iron, which has the element name Fe and the atomic number 26. Energy-dispersive X fluorescence and wavelength dispersive X fluorescence spectral analysis technology was developed and used to the three innermost electron orbitals, namely K, L, and M. The K orbital is the closest to the nucleus, and each electron orbital corresponds to a certain element with a specific energy layer.
Photons of high-energy primary rays generated by the X-ray emission tube strike the sample element during XRF analysis. These fundamental photons have enough energy to derail the innermost electrons, known as the K or L layers. At this point, the atom transforms into an unstable ion. Because electrons seek stability instinctively, electrons in the outer L or M layers will enter the space that makes up the inner layer. As these electrons move from the outer layer to the inner layer, they emit energy known as secondary X-ray photons.
The entire process is known as fluorescence radiation. Each element's secondary rays will have distinct properties. The energy differential between the inner and outer layers during the electron conversion process determines the quantity of energy created by X-ray photon fluorescence radiation. The K energy of an iron atom Fe, for example, is around 6.4 kiloelectron volts. The number or density of X-rays emitted by a certain element over a given time period can be used to calculate its amount. A typical XRF energy distribution spectrum depicts photon density distribution at various energies.
What should I pay attention to when using a Handheld Alloy Analyzer?
When determining the composition of materials with a portable X-ray fluorescence spectrometer (handheld alloy analyzer), three significant criteria must be considered.
Material Composition
From magnesium to heavier elements, the handheld spectrometer alloy analyzer can quantitatively analyse more than 90% of the elements in the periodic table. Most of the elements used in commercial alloys are represented by these quantifiable elements. According to the material composition information collected, the XRF analyzer can detect aluminium alloy, stainless steel, chromium-molybdenum alloy or base alloy, bronze alloy, various other copper alloys, solder, titanium alloy, tool steel, nickel, and cobalt. Elements Many so-called "superalloys" are brand-matchable. The handheld alloy analyzer, however, cannot identify elements lighter than magnesium. Alloying elements such as lithium, beryllium, and carbon are examples of undetectable elements.
The Surface Temperature of the Alloy Analyzer Sample
The physical properties of X-rays employed in XRF analysis technology do not change much when the temperature of the sample changes. Furthermore, the analysis device's design purpose is to be unaffected by changes in ambient circumstances and to always provide reliable measurement performance. Thermal drift and performance deterioration will not occur when the analyzer is operated in the temperature range of -10 °C to 50 °C.
When the sample temperature exceeds roughly 100 °C, the alloy analyzer is not altered, and the sample can be measured normally. However, if the temperature rises above this level, the polypropylene fibre film that forms part of the analyzer glass may be destroyed.
How do users of handheld alloy analyzers go about purchasing high-quality handheld alloy analyzers? This is a critical question. At the end of this post, I recommend Drawell, a maker of high-quality handheld alloy analyzers. Drawell Scientific is a reputable maker of portable alloy analyzers. Always give high-quality products to clients worldwide. They may deliver high-quality alloy analyzers such as the Handheld handheld XRF Gold Analyzer (TrueX Gold) and the Handheld Alloy Analyzer (TrueX 800).
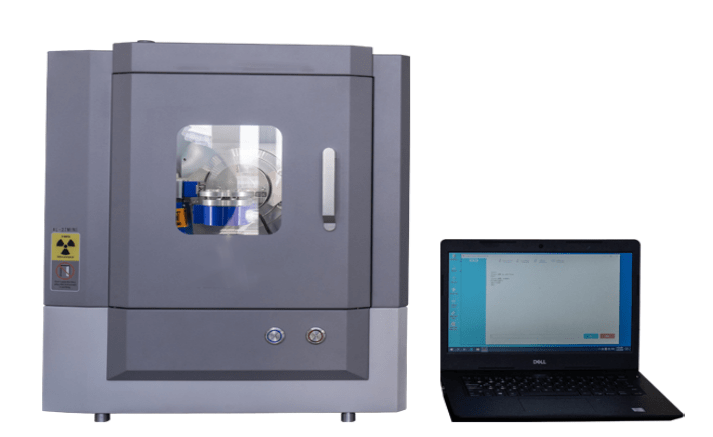
The X-ray diffractometer employs the principle of X-ray diffraction to precisely determine a substance's crystal structure, texture, and stress. An X-ray diffractometer is capable of performing phase analysis, qualitative analysis, and quantitative analysis on substances.
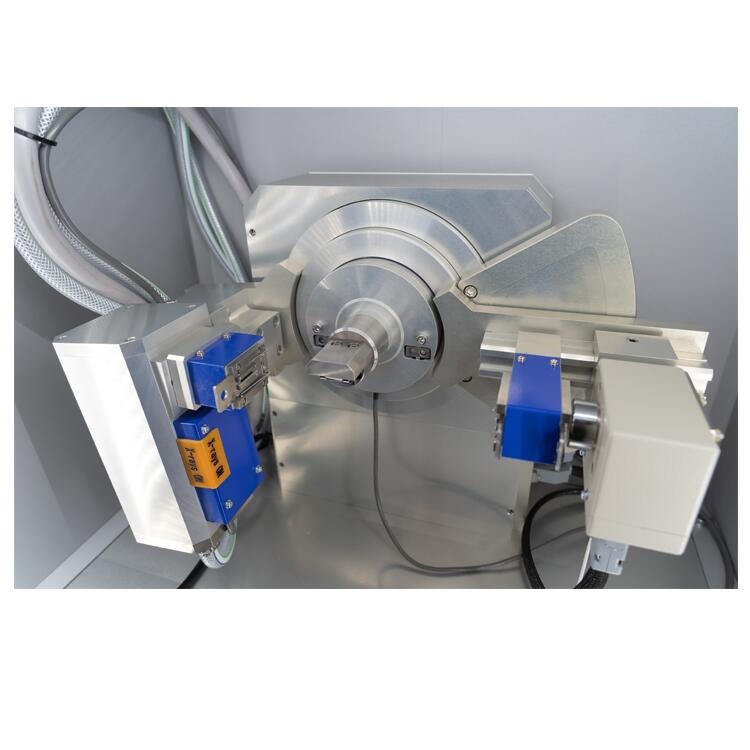
How does an X-ray Diffractometer Work
Characteristic X-ray is an extremely short wavelength electromagnetic wave (approximately 200.06nm) that may penetrate a specific thickness of material and cause fluorescent materials to emit light, photographic latex photosensitivity, and gas ionisation. The X-ray diffractometer produced by the X instrument hitting the metal "target" with electron beams contains characteristic (or identifying) X-rays with certain wavelengths corresponding to various elements in the target.
Given that the wavelength of X-rays is similar to the distance between atoms inside crystals, German physicist M.von Laue proposed an important scientific theory in 1912: crystals can emit diffracted light as X-ray space, which means that when A beam X Rays pass through the crystal, the superposition of diffracted waves will increase the intensity of the rays in some directions while weakening the light in others. Analyzing the diffraction pattern left on the photographic film can reveal the structure of the crystal under test. This theory's viability was demonstrated in future experiments.
What are the Application Areas of X-ray Diffraction
Metallurgy, petroleum, the chemical industry, scientific research, aircraft, teaching, material production, and other fields all make extensive use of X-ray diffraction.
When the X-ray wavelength is known (choose typical X-rays with a set wavelength), you can meet the Bragg criterion by using fine powder or fine-grained polycrystalline linear samples from a pile of crystals with any orientation from any angle. Reflection will occur on the reflecting surface. After measuring, apply the Bragg formula to get the lattice spacing d, unit cell size, and unit cell type.
In X-ray structural analysis, X-ray diffraction uses the theoretical basis of the powder technique or Debye-Scherrer method to calculate the intensity of the diffraction line and hence the arrangement of atoms in the unit cell.
The single-crystal sample used in the Laue method to determine the single crystal orientation must keep the measured substance constant (that is, the remains unchanged), and the wavelength of the radiation beam is used as a variable to ensure that all crystal faces meet the conditions of the Bragg formula, so choose a continuous X-ray beam. Then, for measurement, utilise a crystal with a known structure (known as an analytical crystal). Once the direction of the diffraction line has been determined, the wavelength of the X-ray can be computed to find the element that provides the characteristic X-ray. This is an X-ray spectrometer for determining the composition of metals and alloys.
Then, for measurement, utilise a crystal with a known structure (analysis crystal). After determining the direction of the diffraction line, the crystal's X-ray wavelength can be estimated and analysed to discover its characteristic X-ray element. This is an X-ray spectrometer for determining the composition of metals and alloys.
Application of X-ray Diffractometer in Metallurgy
Then, for measurement, utilise a crystal with a known structure (analysis crystal). After determining the direction of the diffraction line, the crystal's X-ray wavelength can be estimated and analysed to discover its characteristic X-ray element. This is an X-ray spectrometer for determining the composition of metals and alloys.
In the field of mental determination, the most often utilised X-ray diffraction methods are qualitative analysis and quantitative analysis. To determine the phases present in the material, qualitative analysis compares the measured lattice spacing and diffraction intensity of the material to be tested with the diffraction data of the standard phase; quantitative analysis determines the phases of the material to be tested based on the intensity of the diffraction pattern Proportional content.
The accurate estimation of lattice parameters is frequently used to build the phase diagram's solid-state solubility curve. When the solute approaches the solubility limit, if the solute continues to increase, it will cause the precipitation of new phases and will no longer cause the lattice constant to change. This tipping point is known as the dissolution limit. Furthermore, exact measurement of the lattice constant can yield the number of atoms per unit cell, which can be used to define the kind of solid solution; it can also yield valuable physical constants such as density and expansion coefficient.
X-rays can be used to measure grain size (mosaic) and microscopic tension. The size and micro-stress of the crystal grains can be estimated by examining the shape and intensity of the diffracted light pattern. Metal deformation and heat treatment both result in visible changes, and these characteristics have a direct impact on the material's performance.
Furthermore, the X-ray diffractometer can be utilised to investigate the instantaneous dynamics of metals at high, low, and special temperatures.
The preceding is a simple overview of the X-Ray Diffractometer. You must decide whether you require an X-Ray Diffractometer based on your requirements. However, as a piece of essential laboratory equipment, the functionality and purpose of the X-Ray Diffractometer must be confirmed. Furthermore, the X-ray diffractometer can be utilised to investigate the instantaneous dynamics of metals at high, low, and special temperatures. If you have any questions about X-Ray Diffractometer or quickly learn the professional knowledge, please visit the article of "what is X-ray diffractometer"
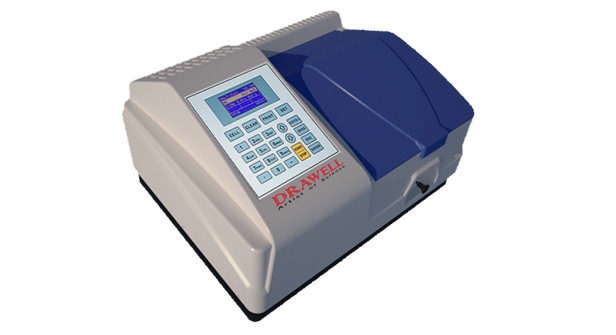
A form of UV spectrophotometer is the UV vis spectrophotometer. It is an analytical equipment based on the principle of ultraviolet-visible spectrophotometry, which analyses the absorption of radiation in the ultraviolet-visible spectrum using material molecules. The light source, monochromator, absorption cell, detector, and signal processor are the primary components. The light source's function is to provide a stable continuous spectrum of suitable intensity.
A hydrogen lamp or a deuterium lamp is typically used in the ultraviolet light zone. A tungsten or halogen lamp is typically used in the visible light zone.
The monochromator's function is to separate the monochromatic light of the desired wavelength from the composite light emitted by the light source.
Dispersive elements are classified into two types: prisms and gratings. A glass absorption cell is used for visible light measurements, and a quartz absorption cell is used for UV measurements.
The detector detects the intensity of the transmitted light using a photoelectric conversion element and converts the light signal into an electrical signal. Phototubes, photomultiplier tubes, and photodiode array detectors are common photoelectric conversion elements.
There are numerous spectrophotometer categorization methods: It is classified into single-beam ultraviolet-visible spectrophotometers and dual-beam ultraviolet-visible spectrophotometers based on the optical path system. It is classified into single-wavelength and dual-wavelength spectrophotometers based on the measurement method. The detection method of producing the spectrogram can be classified as spectrum scanning detection or diode array full spectrum detection.
What is the operation of the UV-Vis spectrophotometer?
The molecule's ultraviolet-visible absorption spectrum is the absorption spectrum created by the electronic energy level transition after some groups in the molecule absorb ultraviolet-visible radiation.
Because different chemicals in the analyte have distinct molecules, atoms, and molecular spatial configurations, their absorption of light energy will change. Spectrophotometric analysis is a powerful tool for investigating the composition, structure, and interaction of substances using their absorption spectra. It is a band-shaped spectrum that reflects information from different groups in the molecule. For qualitative investigation, the conventional light spectrum can be complemented with various methods.
Lambert-Beer's law states that light absorption is proportional to the thickness of the absorption layer, and Beer's law states that light absorption is proportional to the solution concentration; Lambert-Beer's law holds true when both the thickness of the absorption layer and the influence of the solution concentration on the light absorption rate are taken into account. That example, if A=bc (A is the absorbance, is the molar absorption coefficient, b is the liquid pool thickness, and c is the solution concentration), then the solution can be quantitatively analysed. The analytical and control samples are produced in the same solvent at the same concentration, and the ultraviolet-visible absorption spectra are analysed independently under the same conditions. If they are the same substance, their spectra should be the same. If no standard sample is available, it can be compared to a ready-made standard spectrum control.
What is the structure and function of the UV-Vis spectrophotometer?
The UV-Vis spectrophotometer is composed of five parts: light source, monochromator, absorption cell, detector, and signal display system. Light source: A device that produces incident light that meets the specifications. Heat radiation light sources and gas-discharge light sources are the two categories. Thermal radiation light sources, such as tungsten lamps and tungsten halogen lamps, are used in the visible light region, with a wavelength range of 3501000nm; gas-discharge light sources, such as hydrogen and deuterium lamps, are used in the ultraviolet region, with a continuous wavelength range of 180360nm.
The function of a monochromator is to isolate the needed monochromatic light beam from the composite light created by the light source. It is the spectrophotometer's brain.
A cuvette is another name for an absorption cell. Its purpose is to determine the absorbance of the test solution. It has ground glass on the bottom and two sides, and optically clear surfaces on the other two sides. The optical surface of the absorption cell must be complete in order to limit light reflection loss. Perpendicular to the direction of the beam. It can be separated into glass cells and quartz cells based on the material. The former is used to measure the visible light region, whereas the latter is used to measure the ultraviolet light zone.
Detector: An optical signal converter that converts optical signals to electrical signals. Instead of directly detecting the intensity of light flowing through the absorption cell when measuring absorbance, it turns the intensity of light into a current signal for testing. A detector is a photoelectric conversion device.
Signal display system: A device that amplifies and displays the signal emitted by the detector.
What are the features and benefits of the UV vis spectrophotometer
Sensitivity is really high.
Excellent selectivity.
High precision.
Widespread use.
Use a variety of concentrations.
The expense of the analysis is little.
Simple to use.
The analysis is completed quickly.
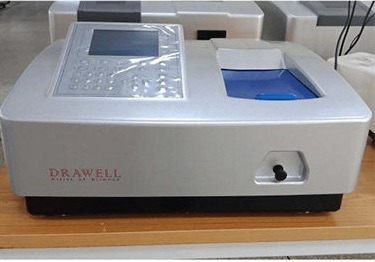
How to choose a high-quality UV-Vis spectrometer is an important topic in the laboratory because it is an important laboratory tool. I'd like to suggest the UV-ViS spectrophotometer from DRAWELL to you. It can provide you with high-quality spectrometers as a professional spectrometer manufacturer. The UV-Vis spectrophotometer from DRAWELL is classified as a single beam spectrophotometer or a double beam spectrophotometer based on the instrument structure, and as a visible spectrophotometer or an ultraviolet spectrophotometer based on the wavelength and atmosphere of the absorbed light. If you have any questions about DRAWELL or UV-Vis Spectrometer, please contact us, and our engineers will offer you with high-quality technical assistance.