Heavy metals, characterized by their high density and potential toxicity, are ubiquitous in the environment. While some heavy metals are essential for biological processes in trace amounts, excessive concentrations pose severe threats to human health and the environment. Monitoring heavy metal levels is crucial to identify contamination sources, assess risks, and implement effective remediation strategies. Atomic Absorption Spectroscopy (AAS) emerges as a frontline technique in this endeavor, offering a precise and sensitive means of heavy metal detection.

What are Heavy Metals?
Heavy metals refer to a group of metallic elements with high atomic weights and densities. Examples include lead, mercury, cadmium, and arsenic. These elements exhibit persistence in the environment, accumulating in soil, water, and organisms. Their non-biodegradable nature and ability to bioaccumulate make them particularly concerning.
Sources of Heavy Metal Contamination and Potential Impacts
Heavy metals find their way into the environment through natural processes, such as the weathering of rocks, as well as anthropogenic activities like industrial discharges, agricultural runoff, and improper waste disposal. Once released, heavy metals can contaminate air, water, and soil, leading to detrimental effects on ecosystems and human health. Chronic exposure to elevated levels of heavy metals is associated with a range of health issues, including neurological disorders, developmental abnormalities, and carcinogenicity.
Why Use AAS for Heavy Metals Analysis?
Atomic Absorption Spectroscopy is a widely used analytical technique for determining trace and heavy metal concentrations in various samples. Here are some reasons why AAS is commonly employed in heavy metal analysis:
Sensitivity: AAS is highly sensitive and capable of detecting metals at very low concentrations, typically in the parts per billion (ppb) or even parts per trillion (ppt) range. This sensitivity is crucial when analyzing environmental samples or biological specimens where trace amounts of heavy metals can have significant impacts.
Selectivity: AAS is selective for specific elements, allowing researchers to focus on analyzing particular metals of interest. Different lamps or hollow cathode lamps can be used to target specific elements, providing a high degree of selectivity.
Quantitative Analysis: AAS allows for accurate and precise quantitative analysis. By measuring the absorption of light at a specific wavelength, the concentration of the metal in the sample can be determined based on the Beer-Lambert law.
Wide Range of Applications: AAS can be used to analyze a wide range of sample types, including water, soil, biological tissues, food, and industrial materials. This versatility makes it valuable for diverse fields such as environmental monitoring, food safety, and metallurgy.
Reliability and Reproducibility: AAS is a well-established and mature analytical technique, which contributes to its reliability and reproducibility. Standardized procedures and calibration methods are widely available, ensuring consistent and accurate results.
Cost-Effectiveness: AAS is often considered a cost-effective method for heavy metal analysis, especially when compared to some alternative techniques. The instrumentation is generally less expensive than some other sophisticated analytical methods.

How are Heavy Metals Analyzed by AAS?
The analysis of heavy metals by Atomic Absorption Spectroscopy (AAS) involves several steps, from sample preparation to quantification. Here’s a general overview:
1. Sample Collection and Preparation:
Collect samples based on the specific environmental or biological matrix under investigation (e.g., water, soil, plant tissues). Prepare samples according to established procedures, which may involve digestion, extraction, or dilution, depending on the matrix and the form of the heavy metals.
2. Calibration Standards:
Prepare a series of calibration standards with known concentrations of the heavy metal(s) of interest. The standards should cover the expected concentration range of the samples.
3. Instrument Setup:
Set up the AAS instrument, ensuring that it is properly calibrated and optimized for the specific heavy metal being analyzed. This includes selecting the appropriate hollow cathode lamp for the element, adjusting the wavelength, and optimizing instrumental parameters.
4. Sample Introduction:
Introduce the prepared sample into the AAS instrument. This can be done using a nebulizer, which converts the liquid sample into an aerosol, or a graphite furnace for solid samples. The choice depends on the sample matrix and the specific requirements of the analysis.
5. Atomization:
In the flame or graphite furnace, the sample undergoes a process of atomization. In the flame, this includes desolvation, vaporization, and atomization of the analyte. In the graphite furnace, the sample is deposited onto a graphite tube and heated to high temperatures for atomization.
6. Absorption Measurement:
The hollow cathode lamp emits light at the resonance wavelength of the specific heavy metal being analyzed. As the atoms in the sample are vaporized and excited, they absorb light at this characteristic wavelength. The amount of absorbed light is proportional to the concentration of the heavy metal in the sample.
7. Calibration Curve:
Measure the absorbance of the calibration standards at the chosen wavelength. Use these measurements to create a calibration curve that relates absorbance to concentration. This curve serves as the basis for quantifying the concentration of the heavy metal in unknown samples.
8. Quantification:
Measure the absorbance of the sample at the resonance wavelength and use the calibration curve to determine the concentration of the heavy metal. AAS is a quantitative technique, providing accurate and precise results when properly calibrated.
9. Quality Control:
Implement quality control measures, such as running blank samples, standard reference materials, and periodic checks with certified reference materials. These measures help ensure the accuracy and reliability of the results.
10. Data Analysis and Reporting:
Analyze the data obtained from the instrument, including absorbance values and concentrations. Report the results, noting any relevant details about the sample matrix, sample preparation, and instrument parameters.
Environmental and Health Implications
Heavy metal exposure poses significant risks to both human health and the environment. Ingestion of contaminated water or food, inhalation of polluted air, and direct contact with contaminated soil contribute to human exposure. Chronic exposure can lead to a range of health problems, from organ damage to neurological disorders. Environmental consequences include soil degradation, water pollution, and disruption of aquatic ecosystems. AAS, with its ability to quantify metal concentrations accurately, plays a pivotal role in assessing and mitigating these risks.
AAS: Guardian of Environmental and Human Well-being
In conclusion, AAS stands as a cornerstone in the realm of heavy metal analysis, providing unparalleled insights into the distribution and concentration of these potentially harmful elements. Continuous monitoring using AAS is imperative for safeguarding both environmental integrity and human health. As heavy metal contamination continues to pose challenges globally, the role of AAS in unraveling these mysteries and facilitating effective interventions becomes increasingly crucial.
Partnering with an AAS Supplier for a Sustainable Future
For laboratories and industries committed to environmental stewardship and public health, choosing the right AAS spectrophotometer supplier is paramount. Reliable AAS instruments and accessories ensure accurate and precise measurements, contributing to the effectiveness of heavy metal monitoring programs. Therefore, selecting a reputable AAS supplier is not just a choice; it’s an investment in a sustainable and healthier future.
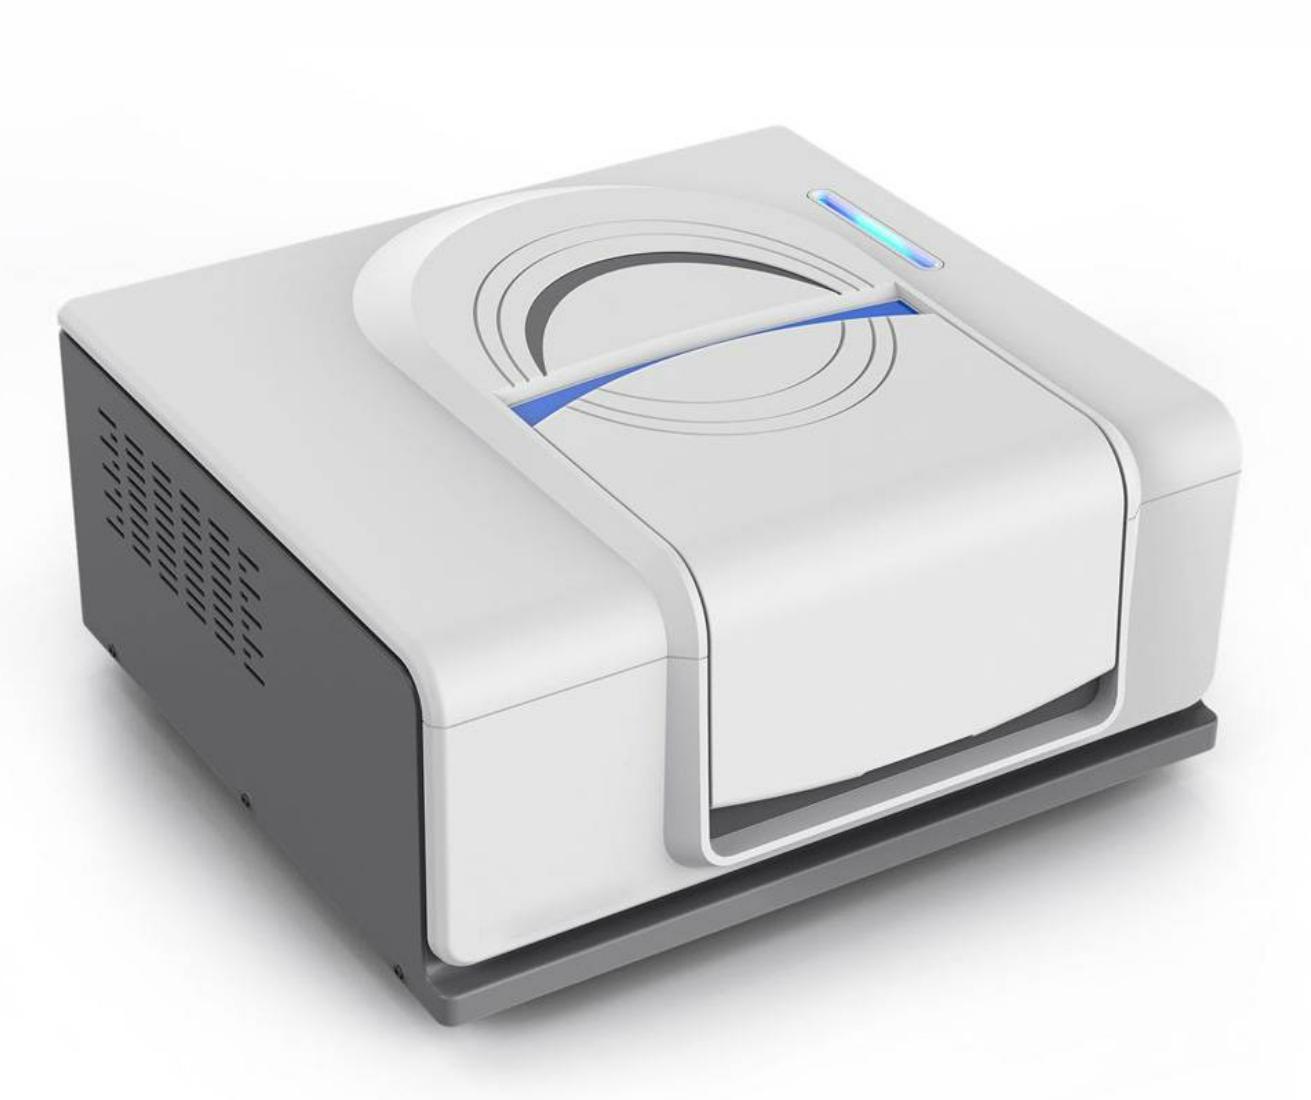
In the realm of analytical chemistry, atomic absorption spectrophotometry (AAS) stands as a powerful technique, facilitating the qualitative and quantitative analysis of elements across a diverse array of samples. Central to this analytical prowess is the atomic absorption spectrophotometer (AAS), an instrumental marvel that enables precise measurements. This article endeavors to provide a comprehensive insight into atomic absorption spectrophotometers, encompassing their operational principles, applications, pricing dynamics, and technological advancements.

Decoding the Atomic Absorption Spectrophotometer
An Overview:
An Atomic Absorption Spectrophotometer (AAS) emerges as a stalwart analytical instrument, wielding the ability to discern the concentration of elements in a sample by scrutinizing light absorption. Widely embraced across scientific and industrial domains, AAS finds utility in environmental monitoring, pharmaceutical analysis, food and beverage testing, and metal analysis, among others.
Principle of Operation:
The bedrock of atomic absorption spectroscopy lies in the absorption of light by atoms in their ground state. Upon introduction of a sample harboring the element of interest into the spectrophotometer, atomization ensues, converting the sample into free atoms. Subsequently, these atoms encounter a light source, typically a hollow cathode lamp or an electrodeless discharge lamp, emitting light at predetermined wavelengths aligning with the absorption lines of the target element.
The sample's atoms selectively absorb light at these specific wavelengths, commensurate with their electronic energy transitions. The spectrophotometer quantifies the absorbed light, directly correlating it with the element's concentration in the sample. By juxtaposing the absorption against a calibration curve crafted using standards of known concentrations, the element's concentration in the sample is elucidated.
Applications and Capabilities:
Atomic absorption spectrophotometers proffer unparalleled sensitivity and selectivity, facilitating the analysis of trace elements amidst complex matrices. These instruments can concurrently or sequentially analyze multiple elements, a feat achieved by modulating the light source's wavelength. Furnishing quantitative data, they enable precise measurements of elemental concentrations, reaching down to parts per million (ppm) or even parts per billion (ppb).

Navigating Atomic Absorption Spectrophotometer Pricing
Unveiling Price Dynamics:
The pricing landscape of atomic absorption spectrophotometers is multifaceted, contingent upon variables such as brand, model, specifications, and additional features. As such, pinpointing an exact price sans specific details poses a challenge.
Typically residing in the realm of high-end instrumentation, atomic absorption spectrophotometers command a premium vis-à-vis other laboratory equipment. Their price spectrum spans from tens of thousands to several hundred thousand dollars.
Seeking Pricing Insights:
For an accurate appraisal of a particular atomic absorption spectrophotometer model, direct engagement with manufacturers, distributors, or suppliers is advised. These stakeholders furnish detailed insights into pricing tailored to individual requirements and specifications.
Unveiling the Operational Mechanisms of Atomic Absorption Spectrophotometers
Delving into Operational Facets:
vAn atomic absorption spectrophotometer (AAS) operates on the bedrock of absorption spectroscopy. Here's a sequential delineation of its modus operandi:Atomization: The sample, harboring the element of interest, undergoes introduction into the AAS instrument. Atomization, the process of converting the sample into free atoms, is achieved through varied techniques like flame atomization, graphite furnace atomization, or cold vapor atomization.
Light Source: A specific light wavelength is imperative for exciting the atoms of the target element. Commonly employed as the light source are hollow cathode lamps or electrodeless discharge lamps, emitting light at the characteristic absorption lines of the element.
Monochromator: The emitted light encompasses a spectrum of wavelengths. The monochromator selects a specific wavelength, sieving out unwanted wavelengths to ensure solely the desired wavelength, aligning with the element's absorption line, traverses through.
Sample Cell: The chosen wavelength of light traverses through the sample cell, housing the atomized sample. Fashioned from transparent materials like quartz, the sample cell facilitates light passage.
Absorption Measurement: As the light permeates the sample cell, the element's atoms therein absorb light at the specific wavelength corresponding to their electronic energy transitions. The spectrophotometer gauges the absorbed light's intensity, directly proportional to the element's concentration in the sample.
Detector and Data Analysis: A detector within the instrument measures the intensity of the absorbed light, translating it into an electrical signal. Subsequent electronic processing, encompassing amplification and signal processing, culminates in the display or recording of the processed signal.
Calibration and Quantification: To ascertain the element's concentration in the sample, a calibration curve is charted employing standard solutions of known concentrations. The instrument juxtaposes the sample's absorption against this calibration curve, thereby computing the element's concentration.
In Conclusion
Atomic absorption spectrophotometers wield a transformative influence in analytical chemistry, epitomizing precision and efficacy in elemental analysis. Their elucidation of operational nuances, coupled with insights into pricing dynamics and technological advancements, underscores their indelible imprint on scientific and industrial landscapes.
FTIR (Fourier Transform Infrared) spectrophotometers represent potent analytical instruments utilized across scientific and industrial realms, furnishing invaluable insights into diverse materials' composition, structure, and properties. This comprehensive discourse embarks on unraveling the operational framework of FTIR spectrophotometers, scrutinizing their cost dynamics, and providing a meticulous guide for selecting the most apt instrument.
Understanding FTIR Spectrophotometers:
FTIR spectrophotometers emerge as sophisticated apparatuses instrumental in dissecting materials' composition and attributes via infrared radiation absorption measurements. They have seamlessly integrated into various scientific domains encompassing chemistry, materials science, pharmaceuticals, environmental science, and forensic analysis. A profound comprehension of FTIR spectrophotometers' operational paradigm is indispensable for effectively harnessing their prowess.
Operational Mechanisms of FTIR Spectrophotometers:
This segment delves into elucidating the foundational principles underpinning FTIR spectrophotometry, encapsulating Fourier Transform Infrared spectroscopy, interferometry, and the intricacies of sample analysis and data processing. Key terminologies like absorption, transmittance, and wavenumber are meticulously expounded upon.
Fourier Transform Infrared Spectroscopy:
The nucleus of FTIR spectrophotometers lies in Fourier Transform Infrared spectroscopy, a technique leveraging the unique interaction between infrared radiation and matter to unearth crucial insights into a sample's chemical composition and molecular structure. Upon exposure to infrared radiation, specific chemical bonds within molecules absorb energy at distinctive frequencies, engendering the generation of an absorption spectrum.

Interferometry and Fourier Transform:
Interferometry assumes a pivotal role in FTIR spectrophotometers for procuring high-resolution spectral data. This entails splitting incoming infrared radiation via a beam splitter into two trajectories - a reference beam and a sample beam. While the sample beam traverses through the specimen, the reference beam circumvents it. Subsequently, the amalgamation of these beams engenders an interference pattern termed an interferogram. Through an apparatus termed an interferometer, the interferogram undergoes Fourier Transform, transitioning from the time domain to the frequency domain, ultimately materializing as a spectrum illustrating infrared radiation absorption by the sample across wavelength or wavenumber.
Sample Analysis and Data Processing:
Following Fourier Transform, the ensuing spectrum delineates infrared absorption intensity against wavenumber. This spectrum harbors peaks corresponding to specific molecular vibrations within the sample. By juxtaposing these peaks with reference spectra or leveraging spectral databases, researchers discern the sample's functional groups, deducing its chemical composition. Data processing techniques like baseline correction, noise reduction, and spectral subtraction are routinely employed to augment the quality and accuracy of FTIR spectra. Advanced data analysis methodologies including peak fitting, spectral deconvolution, and multivariate analysis unravel deeper insights into complex samples. The resultant spectral data, visualized via plots, graphs, or tables, facilitate both qualitative and quantitative analyses, facilitated by a plethora of software packages tailored for processing, analyzing, and interpreting FTIR spectra.
A profound understanding of FTIR spectrophotometers' operational dynamics lays a sturdy foundation for their efficacious utilization across a gamut of applications. Subsequent sections delve into the cost considerations of FTIR spectrophotometers, coupled with a detailed analysis of the Nicolet FTIR spectrophotometer.
Analyzing carbon and sulfur content in various materials is critical across industries like steel, petroleum, environmental monitoring, and research. Carbon Sulfur Analyzers are specialized instruments facilitating accurate measurements, essential for quality control, process optimization, and regulatory compliance. This article explores the features and applications of Carbon Sulfur Analyzers, showcasing their significance in diverse industries.
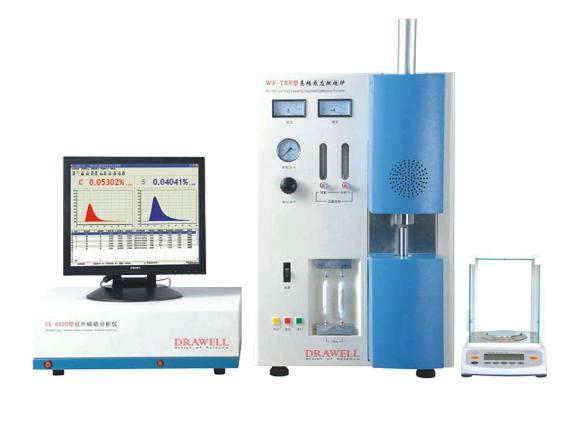
Features of Carbon Sulfur Analyzers
Carbon Sulfur Analyzers may vary in features based on models and manufacturers, yet common attributes include:
High Sensitivity and Accuracy: Designed for precise carbon and sulfur measurement, these analyzers detect trace amounts of elements, ensuring accurate analysis results.
Wide Analytical Range: With a broad range, they analyze samples with varied carbon and sulfur concentrations, accommodating diverse sample types.
Rapid Analysis: Many offer fast analysis times, crucial for efficient sample throughput and productivity, especially in manufacturing and quality control.
Sample Flexibility: Capable of handling solids, liquids, and gases, these analyzers provide flexibility in sample size and form, facilitating analysis of a wide range of materials.
Automation and Software Integration: Advanced models automate sample handling, analysis, and data processing, reducing human error. Integration with software platforms enhances data management and analysis efficiency.
Applications of Carbon Sulfur Analyzers
Carbon Sulfur Analyzers find diverse applications across industries:
Steel and Metal Industry: Crucial for monitoring carbon and sulfur content in raw materials, alloys, and finished products, ensuring quality and process optimization.
Petroleum and Petrochemical Industry: Used to assess carbon and sulfur content in crude oil, refined products, and catalysts, aiding quality control and regulatory compliance.
Environmental Monitoring: Employed to measure emissions from industrial processes, aiding pollution control, regulatory compliance, and air quality evaluation.
Research and Development: Utilized in labs to study material properties, effects of carbon and sulfur content on characteristics and reactivity.
Geological and Mining Applications: Determine carbon and sulfur content in rocks, ores, and minerals, aiding exploration and extraction.
Chemical and Pharmaceutical Industries: Ensure purity and safety standards compliance in raw materials and final products.
Energy Sector: Analyze fuel carbon and sulfur content, optimizing combustion processes and evaluating fuel quality.
Manufacturing and Quality Control: Employed across industries to ensure product quality and compliance with specifications.
Conclusion
Carbon Sulfur Analyzers, with their sensitivity, wide range, rapid analysis, and automation capabilities, serve as indispensable tools in various industries. Their applications encompass quality control, process optimization, environmental monitoring, and compliance. As technology advances, these analyzers will continue enhancing efficiency, accuracy, and sustainability in industrial processes. With their indispensable features and broad applications, Carbon Sulfur Analyzers are vital for precise carbon and sulfur analysis in modern industries.
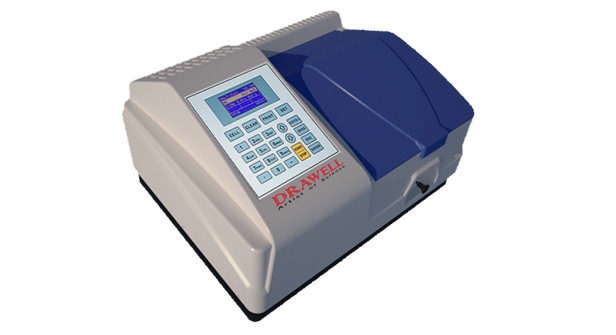
In the realm of analytical chemistry, UV-Vis spectrophotometers play an indispensable role in exploring the interaction between light and matter. These sophisticated instruments empower scientists and researchers to precisely measure the absorption or transmission of light across the ultraviolet (UV) and visible (Vis) regions of the electromagnetic spectrum. Whether you're a novice student conducting experiments in a laboratory or a seasoned scientist analyzing complex samples, proficiency in operating a UV-Vis spectrophotometer is essential for achieving accurate and reliable results. In this comprehensive guide, we will walk you through the essential steps of utilizing a UV-Vis spectrophotometer, enabling you to confidently navigate the intricacies of light-matter interactions and unlock invaluable insights in your research endeavors.
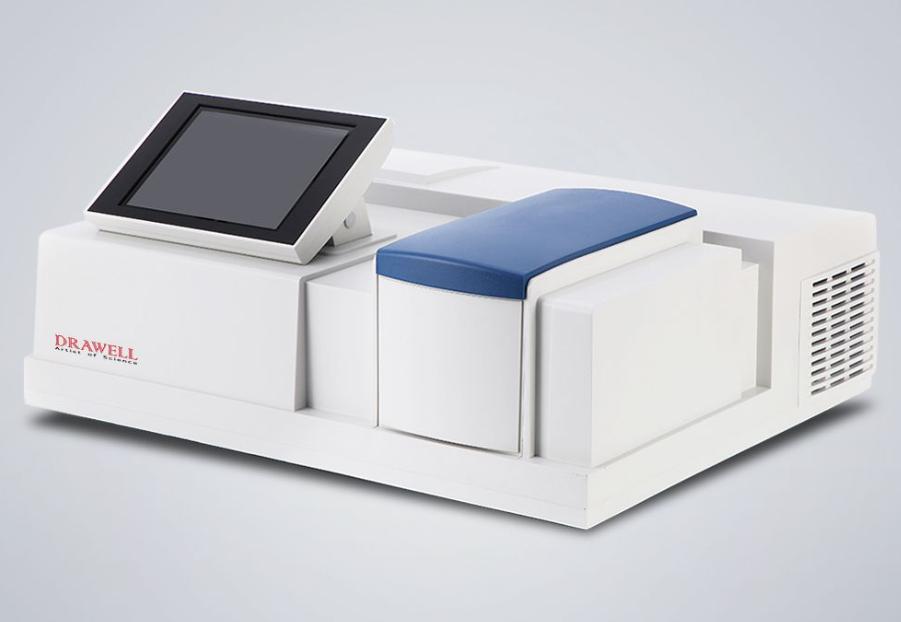
A General Guide on Using a UV-Vis Spectrophotometer:
1. Familiarize Yourself with the Instrument:
Begin by thoroughly reviewing the user manual provided by the UV-Vis spectrophotometer manufacturer to gain insight into the specific features and functionalities of your UV-Vis spectrophotometer.
Verify that the instrument is in optimal working condition by conducting routine checks and maintenance procedures as outlined in the manual.
2. Prepare Your Sample:
Depending on the nature of your analysis, prepare a sample suitable for UV-Vis measurements. This may entail dilution, filtration to remove particulate matter, or other necessary preparatory steps.
3. Set Up the Instrument:
Ensure proper connection of the spectrophotometer to a stable power source and switch it on. Allow the instrument to warm up if required, adhering to the manufacturer's instructions.
Configure the instrument settings, including wavelength range and other parameters specific to your analysis requirements.
4. Perform a Blank Measurement:
Prior to measuring your sample, conduct a blank measurement to establish a baseline absorbance. This involves measuring the absorbance of the solvent or reagent used in your sample, without any analyte present, to serve as a reference point for subsequent measurements.
5. Calibration (if Necessary):
Depending on the analytical requirements, Perform calibration using appropriate standards to ensure precise and accurate measurements of the spectrophotometer, particularly for quantitative analyses.
6. Measure Your Sample:
Place the prepared sample into a clean and flawless cuvette, designed for containing liquid samples. Ensure the cuvette is devoid of scratches or defects that may affect measurement accuracy. Insert the cuvette into the sample compartment of the spectrophotometer.
7. Select the Desired Wavelength:
Set the spectrophotometer to the desired wavelength for your measurement, either manually or through the instrument's control panel or software interface.
8. Initiate Absorbance Measurement:
Commence the measurement process, during which the spectrophotometer emits light at the selected wavelength through the sample. The instrument quantifies the amount of light absorbed by the sample, represented as absorbance (A).
9. Record the Data:
Record the absorbance value obtained from the spectrophotometer for your sample. If conducting measurements across multiple wavelengths, systematically record the data for further analysis.
10. Analyze and Interpret the Data:
Utilize suitable mathematical or statistical methods to analyze the acquired data, correlating absorbance values with the concentration or other relevant parameters of your sample.
Compare results with calibration curves or reference data to derive meaningful interpretations and conclusions from your analysis.
11. Clean Up:
Following completion of measurements, meticulously clean the cuvettes to eliminate any residual sample material. Adhere to proper disposal procedures for any generated waste or chemicals.
Conclusion:
Proficiency in utilizing a UV-Vis spectrophotometer unlocks myriad applications across diverse fields such as pharmaceuticals, environmental analysis, and material science. By adhering to the step-by-step instructions outlined in this guide, you can confidently conduct measurements, analyze your data, and derive meaningful insights. Remember to consult the manufacturer's user manual for specific details regarding your instrument's functionality and features. With practice and a deeper understanding of UV-Vis spectrophotometry principles, you will harness the full potential of this powerful analytical tool, driving scientific progress and contributing to impactful discoveries in your respective disciplines.